Sensor Camparison : Collaboration Netherlands - France
Argo Netherlands and Argo France joined their efforts to compare the new RBR CTD sensors with the standard SBE CTD, deploying pairs of Argo floats in the north of Curaçao, a Dutch Caribbean Island.
Diversifying providers to secure sensor provision at a competitive cost is one of the main current objectives of Euro-Argo, to sustain and expand the Argo floats network.
For that purpose, Argo Netherlands and Argo France collaborated to deploy four floats each during the Mixation cruise, from the Dutch research vessel Pelagia while on transit from Curaçao to a mooring site near Bermuda at the end of April. Thus, this cooperative mission had a specific objective: deploy the Dutch floats equipped with the new RBR CTD sensors side-by-side with French floats that are equipped with the standard SBE CTD, to compare these two sensors.
In January, a similar swarm experiment was conducted by BSH, who deployed five pairs of floats in the frame of the DArgo2025 project in a strong cyclonic eddy in the Northeast Atlantic.
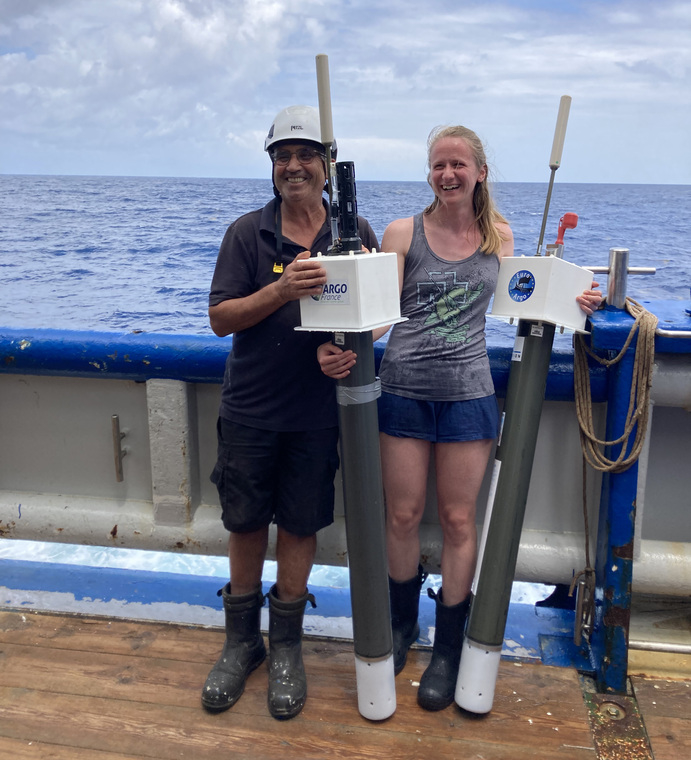
Two Argo floats ready to be deployed. The left one carries a SBE CTD sensor, the right one a RBR CTD sensor.
© Sjoerd Groeskamp
How can floats be deployed to effectively compare their sensors?
- To allow for a thorough inter-comparison between the two sensor types the floats need to be deployed a few metres apart.
- To obtain enough data for comparison, the cycling frequency of the floats was set to two days for the first 15 cycles.
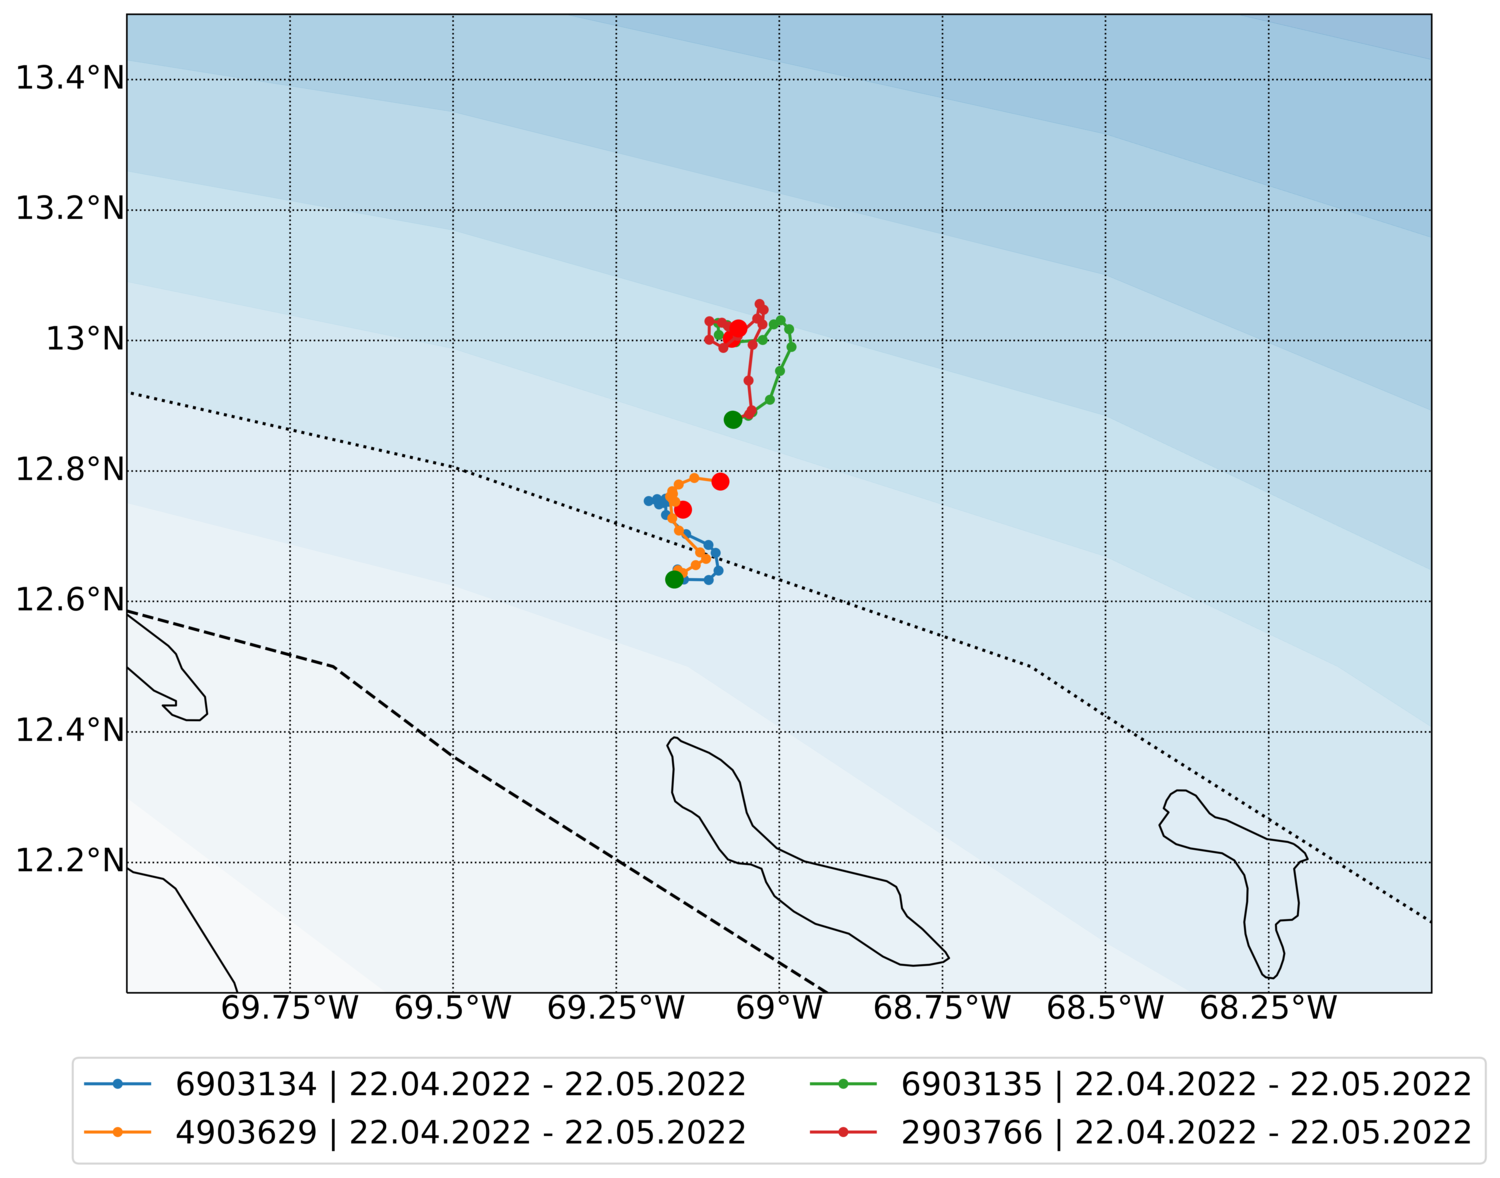
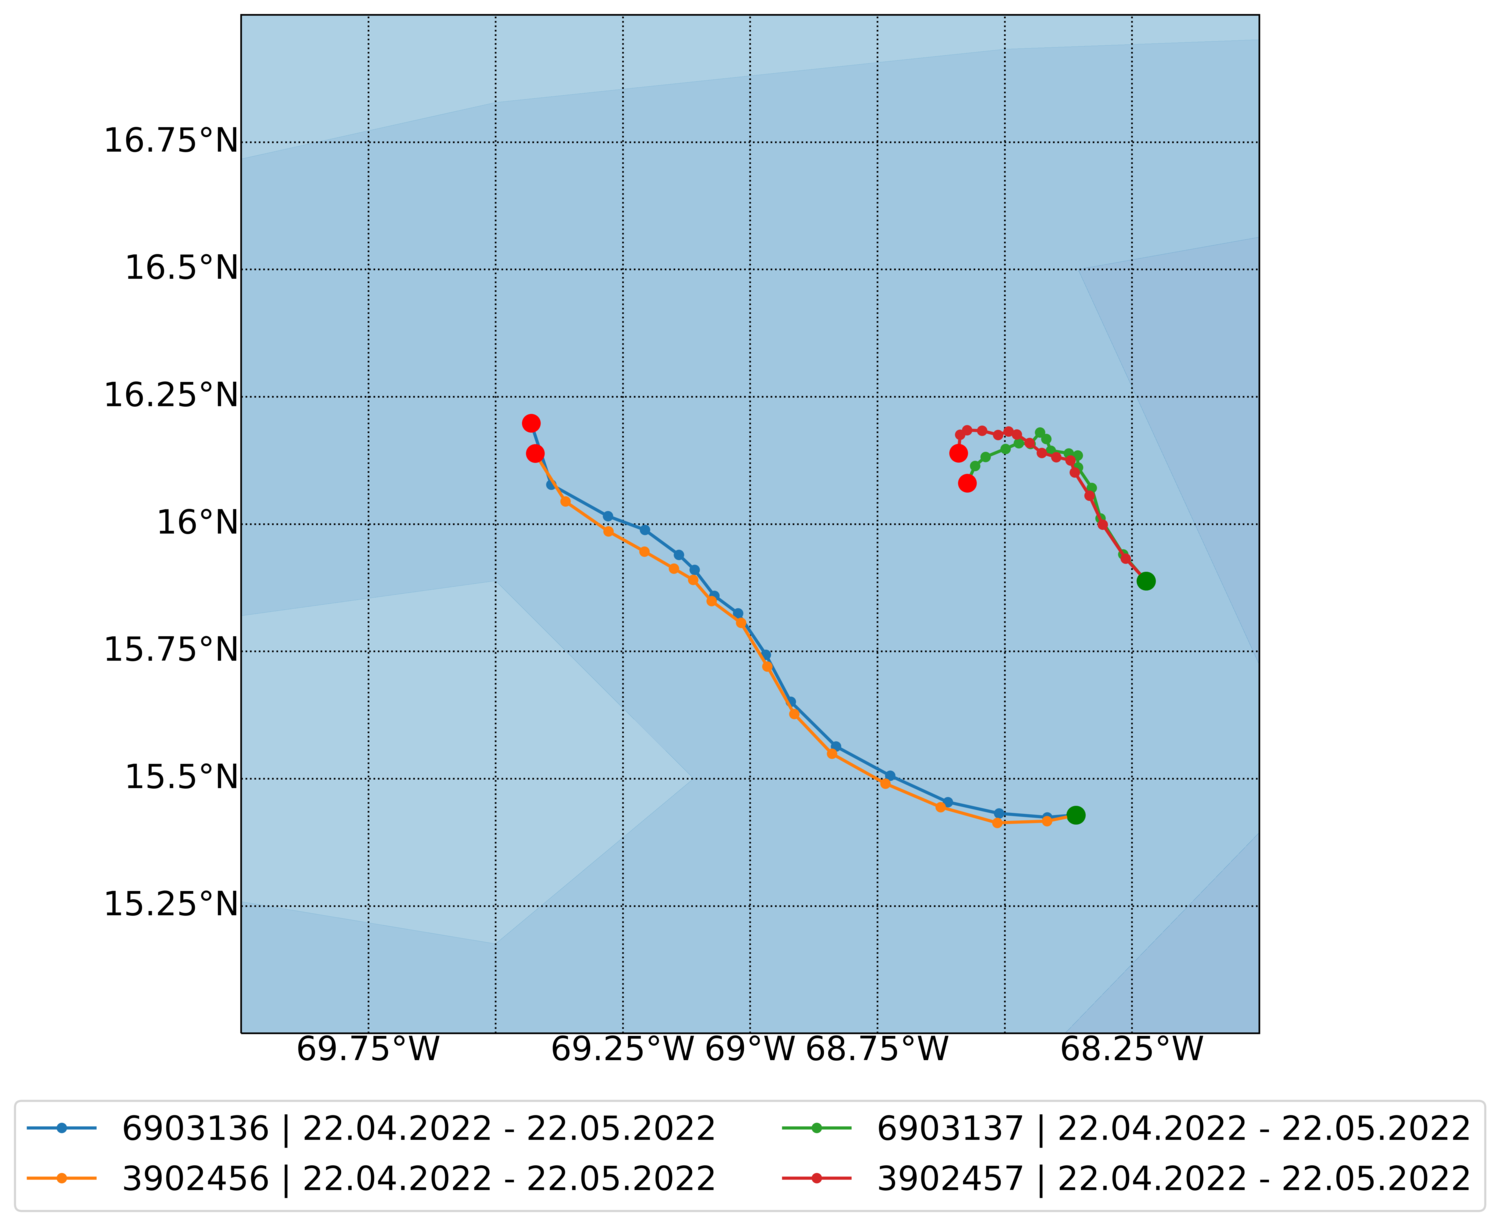
Positions of the floats during their first month of operation. - WMOs of the four Dutch floats equipped with RBR sensors: 3902456, 4903629, 2903766, 3902457 - WMOs of the four French floats equipped with SBE sensors: 6903137, 6903136, 6903135, 6903134 After one month, the distance between the floats of each pair was only a few kilometres! | |
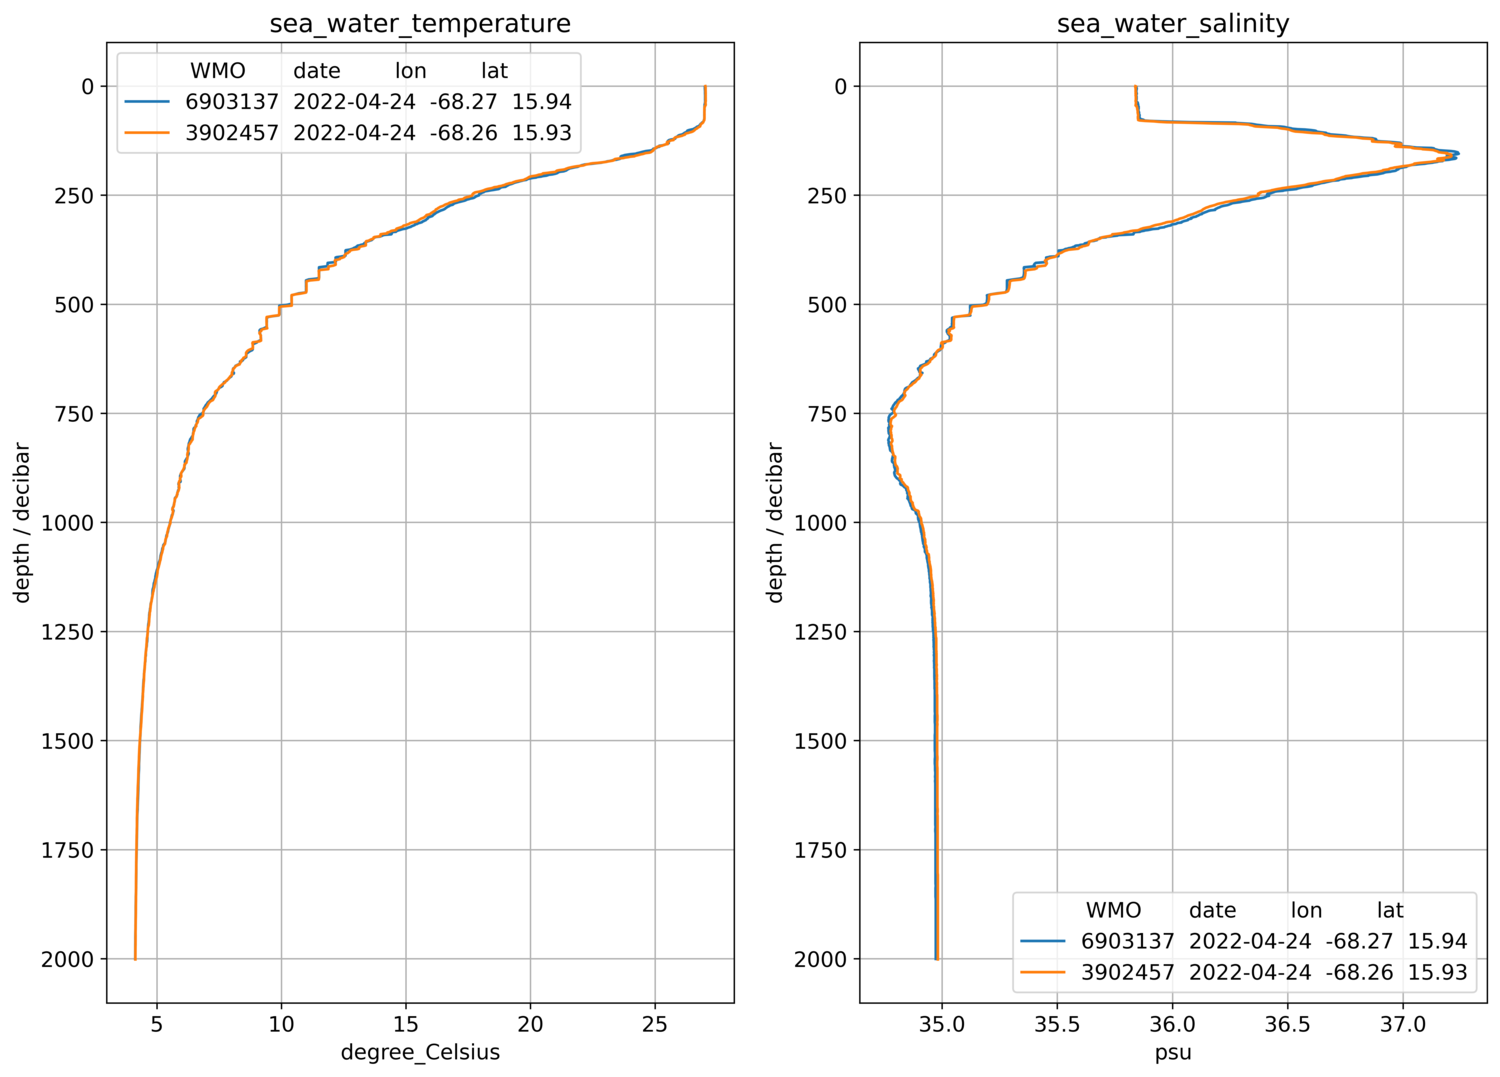
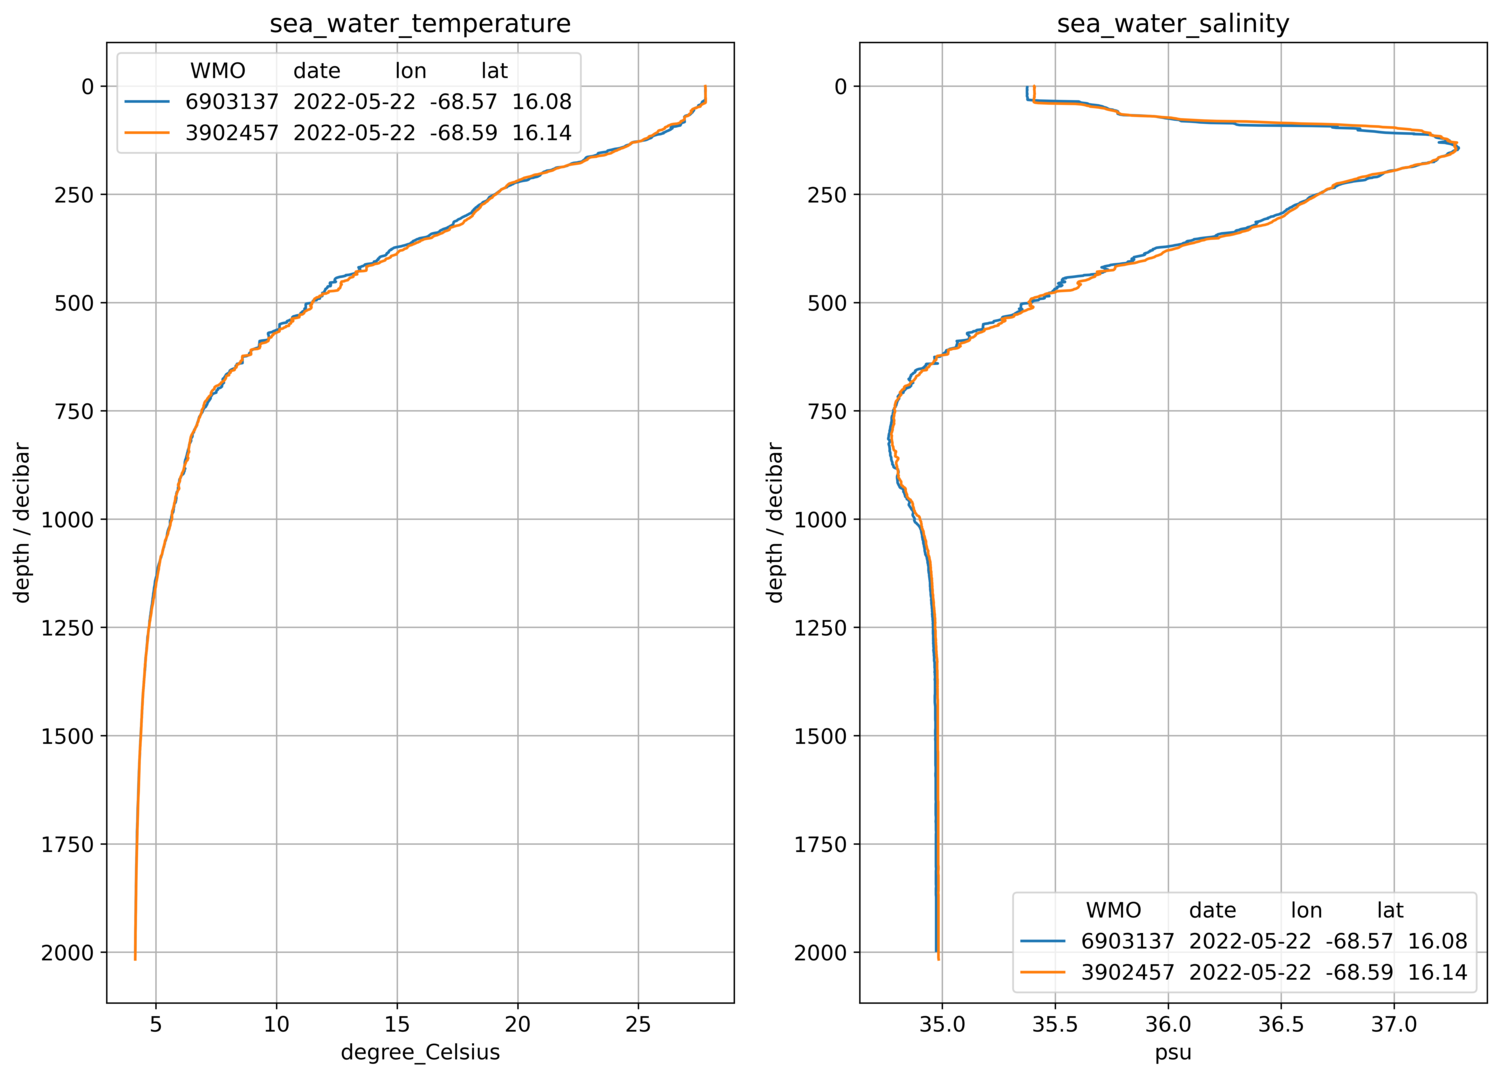
First full-depth profile, two days after launch | After one month (15 cycles) |
The first profiles, taken when the floats were practically at the same position, show that both sensors give the same results. A close look at the measured values shows that below 1500 dbar, where the impact of natural variability is small, the differences between the two sensors are smaller than 0.02 K for temperature and 0.01 PSU for salinity. These differences are also found for the other float pairs. For temperature, the differences are larger than the required accuracy of 0.002 K, while for salinity they are just within the error bounds of 0.01 PSU. | One month later, the picture has not changed much over most of the depth range. However, some clear differences occur in a range around roughly 500 dbar. These differences cannot be explained by sensor differences but are clearly of physical origin. Obviously, natural variability is large enough in this depth range to produce such differences on a scale of a few kilometres. It is the same depth range in which staircase-like changes in T and S can be seen. Such staircases are produced by double diffusive mixing, so called “salt-fingering” (e.g., van der Boog et al. (2019), doi:10.1029/2018JC014877). |
Profiles of temperature and salinity from one pair of floats. Float WMO ID 6903137 (blue) is equipped with a SBE sensor, float WMO ID 3902457 (orange) with a RBR sensor. | |

