


May
Numerical models of ocean biogeochemistry are becoming the major tools used to detect and predict the impact of climate change on marine resources and to monitor ocean health. Discover how machine learning techniques combined with BGC Argo observations can help assessing ocean BGC model performances, in this study where the new method is applied to the CMEMS Global Ocean Biogeochemistry Analysis and Forecast system.
"Using machine learning and Biogeochemical-Argo (BGC-Argo) floats to assess biogeochemical models and optimize observing system design"
Biogeosciences, 20, 1405–1422, 2023
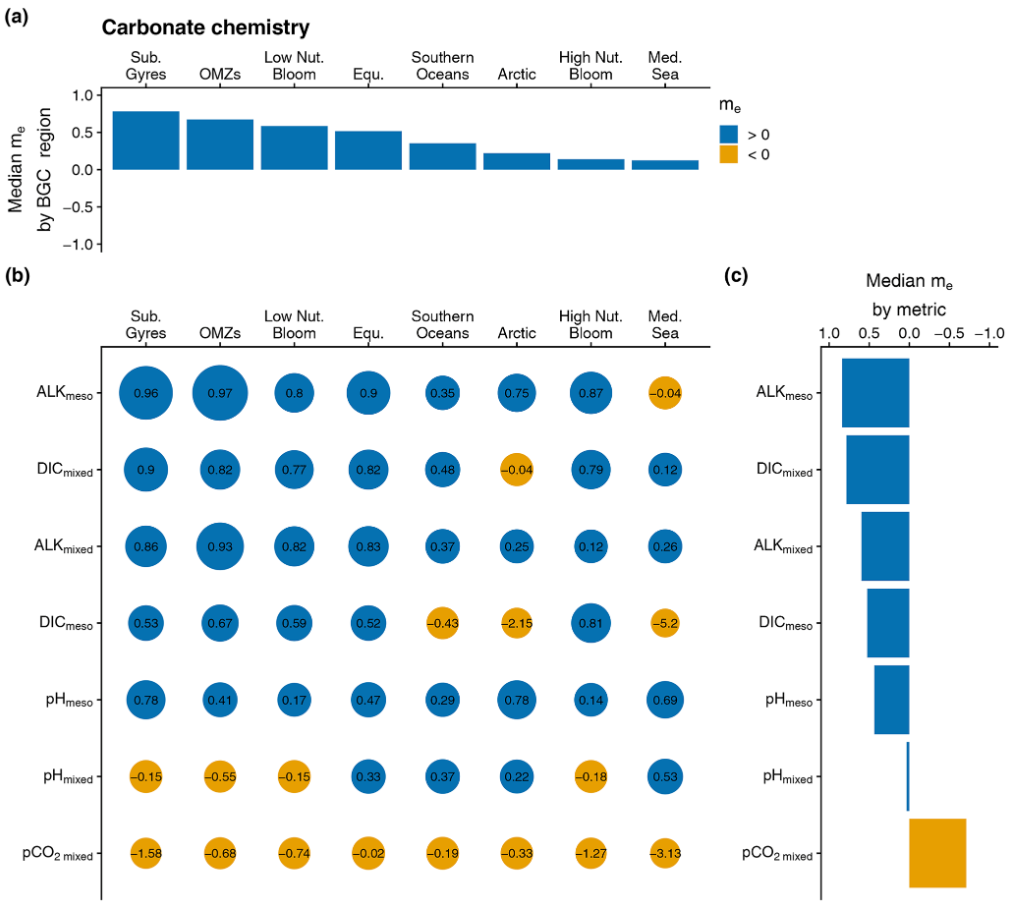
Figure 3(b) Bubble plot of the model efficiency statistical score (me) as a function of BGC regions (Arctic, equatorial (Equ.), high nutrient bloom (High Nut. Bloom), low nutrient bloom (Low Nut. Bloom), Mediterranean Sea (Med. Sea), oxygen minimum zones (OMZs), Southern Oceans, and subtropical gyres (Sub. Gyres)) and the assessment metrics associated with the carbonate chemistry (depth-averaged pCO2 in the mixed layer (pCO2 mixed), depth-averaged DIC in the mixed layer (DICmixed), depth-averaged Alk in the mixed layer (Alkmixed), depth-averaged DIC in the mesopelagic layer (DICmeso), depth-averaged Alk in the mesopelagic layer (Alkmeso), depth-averaged pH in the mixed layer (pHmixed), and depth-averaged pH in the mesopelagic layer (pHmeso)). The size of a bubble is proportional to the value of me. For a given assessment metric, the median values of me over all BGC regions are represented as a bar plot in panel (c). Similarly, for a given BGC region, the median values of me across all assessment metrics are represented as a bar plot in panel (a). In panel (b), the x and y axes are arranged in descending order of the median value of me over all assessment metrics and the median value of me over all BGC regions, respectively. The blue and orange colors correspond to a positive and negative me, respectively.