


February
Learn more about oxygen variability in the North Atlantic Ocean, a key region for the oxygen supply into the deep ocean, thanks to this study relying on #Argofloats data and repeated ship-based sections.
"Subpolar gyre decadal variability explains the recent oxygenation in the Irminger Sea"
COMMUNICATIONS EARTH & ENVIRONMENT (2022) 3:279
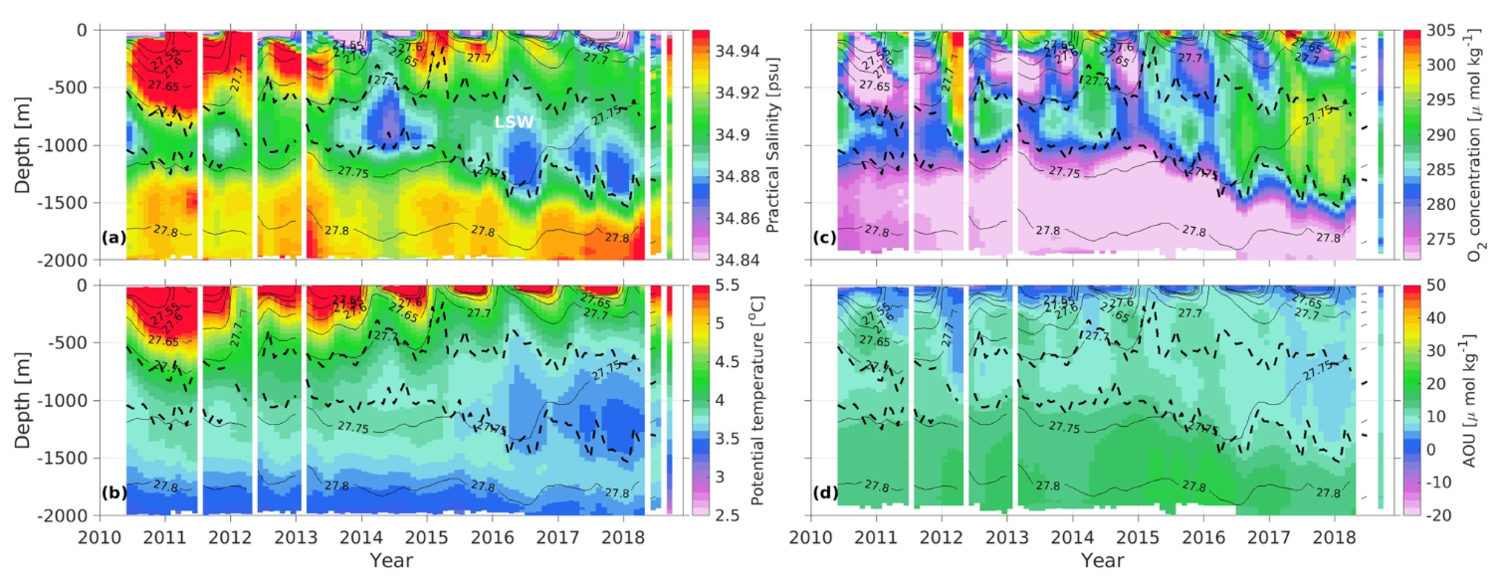
Fig. 4: Temporal variability of the water properties in the Irminger Sea from Argo data. Variability between 2010 and 2018 of a salinity (psu), b potential temperature θ (∘C), c oxygen concentration (μmol kg−1), and d Apparent Oxygen Utilization AOU (μmol kg−1) computed from Argo data in the Irminger Sea. The dashed black contours highlight the lower and upper boundaries of the Labrador Sea Water (LSW) layer. Note that the vertical white lines indicate missing data for interpolation.