
The netCDF format#
%%HTML
<center>
<iframe width="560" height="315" src="https://drive.google.com/file/d/1rm_6tH2wuJnvqcXSUYiYRNyLcPTBtcRk/preview" width="640" height="480" title="The Argo Data" frameborder="0" allow="accelerometer; autoplay; clipboard-write; encrypted-media; gyroscope; picture-in-picture" allowfullscreen></iframe>
</center>
What is NetCDF?#
 netCDF stands for Network Common Data Form and it is a set of software libraries and machine-independent data formats that support the creation, access, and sharing of array-oriented scientific data. It is also a community standard for sharing scientific data.
NetCDF is maintained by Unidata, one of the University Corporation for Atmospheric Research (UCAR)’s Community Programs (UCP). Unidata also supports and maintains netCDF programming interfaces for C, C++, Java, and Fortran. Programming interfaces are also available for Python, IDL, MATLAB, R, Ruby, and Perl. Thanks UCAR!!
%%HTML
<center>
<iframe width="560" height="315" src="https://drive.google.com/file/d/19jrboTjYKxSjQ9Ry15xKEAf0yxPS34WA/preview" width="640" height="480" title="The Argo Data" frameborder="0" allow="accelerometer; autoplay; clipboard-write; encrypted-media; gyroscope; picture-in-picture" allowfullscreen></iframe>
</center>
How is the netCDF format?#
The properties that make netCDF so useful are the following ones:
Self-Describing A netCDF file includes information about the data it contains.
Portable A netCDF file can be accessed by computers with different ways of storing integers, characters, and floating-point numbers.
Sharable One writer and multiple readers may simultaneously access the same netCDF file.
Scalable Small subsets of large datasets in various formats may be accessed efficiently through netCDF interfaces, even from remote servers.
Appendable Data may be appended to a properly structured netCDF file without copying the dataset or redefining its structure.
Archivable Access to all earlier forms of netCDF data will be supported by current and future versions of the software.
Exploring a netCDF File#
Let’s see most of these properties of a netCDF file by using actual data from the high-resolution Blended Analysis of daily Sea Surface Temperature, NOAA OI SST V2 High-Resolution Dataset Thanks NOAA!!
I have pre-downloaded the daily data from 2019 and it is in the ./Data folder. Refer to the section Data used in the Argo Online School to learn how to download the data, if you have not done it yet.
Although there are several methods to read netCDF data in python, we will begin with netcdf4-python, the unidata Python interface to the netCDF C library.
Let’s import the libraries.
import netCDF4
import numpy as np
fileExampleNC='../../Data/sst.day.mean.2020.nc'
Open the netCDF file#
We will create SST, a Dataset object, representing an open netCDF file. The data actually is not read yet (just have a reference to the variable object with metadata).
ncDS = netCDF4.Dataset(fileExampleNC)
type(ncDS)
netCDF4._netCDF4.Dataset
And here it comes the Self-Describing property of the netCDF format, with all information about the data it contains. The information provided depends on the particular data set, as we will see for Argo data.
Printing the object gives you summary information.
print(ncDS)
<class 'netCDF4._netCDF4.Dataset'>
root group (NETCDF4_CLASSIC data model, file format HDF5):
Conventions: CF-1.5
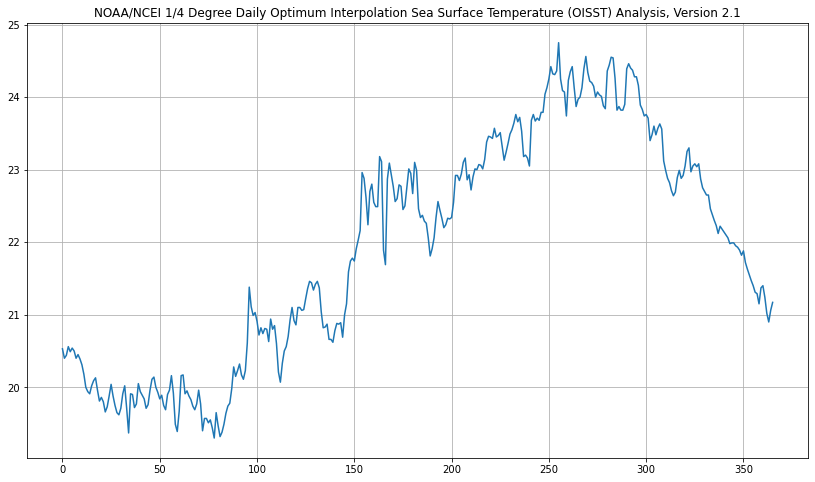
title: NOAA/NCEI 1/4 Degree Daily Optimum Interpolation Sea Surface Temperature (OISST) Analysis, Version 2.1
institution: NOAA/National Centers for Environmental Information
source: NOAA/NCEI https://www.ncei.noaa.gov/data/sea-surface-temperature-optimum-interpolation/v2.1/access/avhrr/
References: https://www.psl.noaa.gov/data/gridded/data.noaa.oisst.v2.highres.html
dataset_title: NOAA Daily Optimum Interpolation Sea Surface Temperature
version: Version 2.1
comment: Reynolds, et al.(2007) Daily High-Resolution-Blended Analyses for Sea Surface Temperature (available at https://doi.org/10.1175/2007JCLI1824.1). Banzon, et al.(2016) A long-term record of blended satellite and in situ sea-surface temperature for climate monitoring, modeling and environmental studies (available at https://doi.org/10.5194/essd-8-165-2016). Huang et al. (2020) Improvements of the Daily Optimum Interpolation Sea Surface Temperature (DOISST) Version v02r01, submitted.Climatology is based on 1971-2000 OI.v2 SST. Satellite data: Pathfinder AVHRR SST and Navy AVHRR SST. Ice data: NCEP Ice and GSFC Ice. Data less than 15 days old may be subject to revision.
dimensions(sizes): time(366), lat(720), lon(1440)
variables(dimensions): float64 time(time), float32 lat(lat), float32 lon(lon), float32 sst(time, lat, lon)
groups:
Exploring a netCDF File with xarray#
![]() Before continuing with the descrption of the netCDF format, we would swtich to xarray .
Before continuing with the descrption of the netCDF format, we would swtich to xarray .
Although netCDF4-python provides a lower-level interface for working with netCDF in Python, xarray uses netCDF4-python internally, it is more user-friendly than netCDF4. Additionally, xarray is used by argopy, the Argo data python library that aims to ease Argo data access, and that is used in te Argo Online School. xarray does not yet support all of netCDF4-python’s features, such as modifying files on-disk, but this is beyond the objective of this school.
A brief introduction for xarray here
Open the netCDF file with xarray#
We will create xrDS, a Dataset object, representing an open netCDF file. The data is not read yet, it just has a reference to the variable object with metadata.
First, we have to import the xarray library, and netcdf4 and matplotlib, since both are used internally by xarray.
import netCDF4
import xarray as xr
from matplotlib import pyplot as plt
%matplotlib inline
xrDS = xr.open_dataset(fileExampleNC)
type(xrDS)
xarray.core.dataset.Dataset
Printing the object gives you summary information
print(xrDS)
<xarray.Dataset>
Dimensions:  (time: 366, lat: 720, lon: 1440)
Coordinates:
  * time     (time) datetime64[ns] 2020-01-01 2020-01-02 ... 2020-12-31
  * lat      (lat) float32 -89.88 -89.62 -89.38 -89.12 ... 89.38 89.62 89.88
  * lon      (lon) float32 0.125 0.375 0.625 0.875 ... 359.1 359.4 359.6 359.9
Data variables:
    sst      (time, lat, lon) float32 ...
Attributes:
    Conventions:    CF-1.5
    title:          NOAA/NCEI 1/4 Degree Daily Optimum Interpolation Sea Surf...
    institution:    NOAA/National Centers for Environmental Information
    source:         NOAA/NCEI https://www.ncei.noaa.gov/data/sea-surface-temp...
    References:     https://www.psl.noaa.gov/data/gridded/data.noaa.oisst.v2....
    dataset_title:  NOAA Daily Optimum Interpolation Sea Surface Temperature
    version:        Version 2.1
    comment:        Reynolds, et al.(2007) Daily High-Resolution-Blended Anal...
And again here it comes the Self-Describing property of the netCDF format, with all information about the data it contains. The information provided depends on the particular data set, as we will see for Argo data.
However xarray has implemented a more user-friendly way of accessing the metadata stored in the Dataset
xrDS
<xarray.Dataset>
Dimensions:  (time: 366, lat: 720, lon: 1440)
Coordinates:
  * time     (time) datetime64[ns] 2020-01-01 2020-01-02 ... 2020-12-31
  * lat      (lat) float32 -89.88 -89.62 -89.38 -89.12 ... 89.38 89.62 89.88
  * lon      (lon) float32 0.125 0.375 0.625 0.875 ... 359.1 359.4 359.6 359.9
Data variables:
    sst      (time, lat, lon) float32 ...
Attributes:
    Conventions:    CF-1.5
    title:          NOAA/NCEI 1/4 Degree Daily Optimum Interpolation Sea Surf...
    institution:    NOAA/National Centers for Environmental Information
    source:         NOAA/NCEI https://www.ncei.noaa.gov/data/sea-surface-temp...
    References:     https://www.psl.noaa.gov/data/gridded/data.noaa.oisst.v2....
    dataset_title:  NOAA Daily Optimum Interpolation Sea Surface Temperature
    version:        Version 2.1
comment: Reynolds, et al.(2007) Daily High-Resolution-Blended Anal...- time: 366
- lat: 720
- lon: 1440
- time(time)datetime64[ns]2020-01-01 ... 2020-12-31
- long_name :
- Time
- delta_t :
- 0000-00-01 00:00:00
- avg_period :
- 0000-00-01 00:00:00
- axis :
- T
- actual_range :
- [80353. 80718.]
array(['2020-01-01T00:00:00.000000000', '2020-01-02T00:00:00.000000000', '2020-01-03T00:00:00.000000000', ..., '2020-12-29T00:00:00.000000000', '2020-12-30T00:00:00.000000000', '2020-12-31T00:00:00.000000000'], dtype='datetime64[ns]') - lat(lat)float32-89.88 -89.62 ... 89.62 89.88
- long_name :
- Latitude
- standard_name :
- latitude
- units :
- degrees_north
- actual_range :
- [-89.875 89.875]
- axis :
- Y
array([-89.875, -89.625, -89.375, ..., 89.375, 89.625, 89.875], dtype=float32) - lon(lon)float320.125 0.375 0.625 ... 359.6 359.9
- long_name :
- Longitude
- standard_name :
- longitude
- units :
- degrees_east
- actual_range :
- [1.25000e-01 3.59875e+02]
- axis :
- X
array([1.25000e-01, 3.75000e-01, 6.25000e-01, ..., 3.59375e+02, 3.59625e+02,
       3.59875e+02], dtype=float32)
- sst(time, lat, lon)float32...
- long_name :
- Daily Sea Surface Temperature
- units :
- degC
- valid_range :
- [-3. 45.]
- precision :
- 2.0
- dataset :
- NOAA High-resolution Blended Analysis
- var_desc :
- Sea Surface Temperature
- level_desc :
- Surface
- statistic :
- Mean
- parent_stat :
- Individual Observations
- actual_range :
- [-1.8 35.059998]
[379468800 values with dtype=float32]
- Conventions :
- CF-1.5
- title :
- NOAA/NCEI 1/4 Degree Daily Optimum Interpolation Sea Surface Temperature (OISST) Analysis, Version 2.1
- institution :
- NOAA/National Centers for Environmental Information
- source :
- NOAA/NCEI https://www.ncei.noaa.gov/data/sea-surface-temperature-optimum-interpolation/v2.1/access/avhrr/
- References :
- https://www.psl.noaa.gov/data/gridded/data.noaa.oisst.v2.highres.html
- dataset_title :
- NOAA Daily Optimum Interpolation Sea Surface Temperature
- version :
- Version 2.1
- comment :
- Reynolds, et al.(2007) Daily High-Resolution-Blended Analyses for Sea Surface Temperature (available at https://doi.org/10.1175/2007JCLI1824.1). Banzon, et al.(2016) A long-term record of blended satellite and in situ sea-surface temperature for climate monitoring, modeling and environmental studies (available at https://doi.org/10.5194/essd-8-165-2016). Huang et al. (2020) Improvements of the Daily Optimum Interpolation Sea Surface Temperature (DOISST) Version v02r01, submitted.Climatology is based on 1971-2000 OI.v2 SST. Satellite data: Pathfinder AVHRR SST and Navy AVHRR SST. Ice data: NCEP Ice and GSFC Ice. Data less than 15 days old may be subject to revision.
All these meta information can be used for any purpose
A list of all the data variables in the netCDF file
xrDS.data_vars
Data variables:
    sst      (time, lat, lon) float32 ...
A list of some attributes for all the variables and coordinates in the data set:
for d in xrDS.data_vars:
    print(xrDS.data_vars[d].long_name)
    print(xrDS.data_vars[d].dims)
Daily Sea Surface Temperature
('time', 'lat', 'lon')
for d in xrDS.coords:
    print(xrDS.coords[d].long_name,xrDS.dims[d])
Time 366
Latitude 720
Longitude 1440
Use of the general attributes of the Dataset [in two ways]
print('We are exploring', xrDS.attrs['dataset_title'] ,'from ',xrDS.attrs['source'], 'in its version', xrDS.attrs['version'])
We are exlploring NOAA Daily Optimum Interpolation Sea Surface Temperature from NOAA/NCEI https://www.ncei.noaa.gov/data/sea-surface-temperature-optimum-interpolation/v2.1/access/avhrr/ in its version Version 2.1
print('We are exploring', xrDS.dataset_title ,'from ',xrDS.source, 'in its version', xrDS.version)
We are exlploring NOAA Daily Optimum Interpolation Sea Surface Temperature from NOAA/NCEI https://www.ncei.noaa.gov/data/sea-surface-temperature-optimum-interpolation/v2.1/access/avhrr/ in its version Version 2.1
Accessing a netCDF data variable#
data variable objects stored by name in
data_varsdict.print the variable yields summary info: range, long_name for the variable, dimensions, fillvalue, etc. All the information necessary used to use the variable
xrDS.data_vars['sst']
<xarray.DataArray 'sst' (time: 366, lat: 720, lon: 1440)>
[379468800 values with dtype=float32]
Coordinates:
  * time     (time) datetime64[ns] 2020-01-01 2020-01-02 ... 2020-12-31
  * lat      (lat) float32 -89.88 -89.62 -89.38 -89.12 ... 89.38 89.62 89.88
  * lon      (lon) float32 0.125 0.375 0.625 0.875 ... 359.1 359.4 359.6 359.9
Attributes:
    long_name:     Daily Sea Surface Temperature
    units:         degC
    valid_range:   [-3. 45.]
    precision:     2.0
    dataset:       NOAA High-resolution Blended Analysis
    var_desc:      Sea Surface Temperature
    level_desc:    Surface
    statistic:     Mean
    parent_stat:   Individual Observations
actual_range: [-1.8 35.059998]- time: 366
- lat: 720
- lon: 1440
- ...
[379468800 values with dtype=float32]
- time(time)datetime64[ns]2020-01-01 ... 2020-12-31
- long_name :
- Time
- delta_t :
- 0000-00-01 00:00:00
- avg_period :
- 0000-00-01 00:00:00
- axis :
- T
- actual_range :
- [80353. 80718.]
array(['2020-01-01T00:00:00.000000000', '2020-01-02T00:00:00.000000000', '2020-01-03T00:00:00.000000000', ..., '2020-12-29T00:00:00.000000000', '2020-12-30T00:00:00.000000000', '2020-12-31T00:00:00.000000000'], dtype='datetime64[ns]') - lat(lat)float32-89.88 -89.62 ... 89.62 89.88
- long_name :
- Latitude
- standard_name :
- latitude
- units :
- degrees_north
- actual_range :
- [-89.875 89.875]
- axis :
- Y
array([-89.875, -89.625, -89.375, ..., 89.375, 89.625, 89.875], dtype=float32) - lon(lon)float320.125 0.375 0.625 ... 359.6 359.9
- long_name :
- Longitude
- standard_name :
- longitude
- units :
- degrees_east
- actual_range :
- [1.25000e-01 3.59875e+02]
- axis :
- X
array([1.25000e-01, 3.75000e-01, 6.25000e-01, ..., 3.59375e+02, 3.59625e+02,
       3.59875e+02], dtype=float32)
- long_name :
- Daily Sea Surface Temperature
- units :
- degC
- valid_range :
- [-3. 45.]
- precision :
- 2.0
- dataset :
- NOAA High-resolution Blended Analysis
- var_desc :
- Sea Surface Temperature
- level_desc :
- Surface
- statistic :
- Mean
- parent_stat :
- Individual Observations
- actual_range :
- [-1.8 35.059998]
We can just extract one single Data variable. In the case of the NOAA Daily Optimum Interpolation Sea Surface Temperature, there is only one Data variable, SST, but it is useful for later when we use the Argo data
print the variable yields summary info: range, long_name for the variable, dimensions, fillvalue, etc. All the information necessary is used to use the variable.
xarray is so clever that it will maintain its coordinates, time, lat and lon, in this case.
# Just focus on Sea Surface Temperature variable
sst = xrDS.sst
sst
<xarray.DataArray 'sst' (time: 366, lat: 720, lon: 1440)>
[379468800 values with dtype=float32]
Coordinates:
  * time     (time) datetime64[ns] 2020-01-01 2020-01-02 ... 2020-12-31
  * lat      (lat) float32 -89.88 -89.62 -89.38 -89.12 ... 89.38 89.62 89.88
  * lon      (lon) float32 0.125 0.375 0.625 0.875 ... 359.1 359.4 359.6 359.9
Attributes:
    long_name:     Daily Sea Surface Temperature
    units:         degC
    valid_range:   [-3. 45.]
    precision:     2.0
    dataset:       NOAA High-resolution Blended Analysis
    var_desc:      Sea Surface Temperature
    level_desc:    Surface
    statistic:     Mean
    parent_stat:   Individual Observations
actual_range: [-1.8 35.059998]- time: 366
- lat: 720
- lon: 1440
- ...
[379468800 values with dtype=float32]
- time(time)datetime64[ns]2020-01-01 ... 2020-12-31
- long_name :
- Time
- delta_t :
- 0000-00-01 00:00:00
- avg_period :
- 0000-00-01 00:00:00
- axis :
- T
- actual_range :
- [80353. 80718.]
array(['2020-01-01T00:00:00.000000000', '2020-01-02T00:00:00.000000000', '2020-01-03T00:00:00.000000000', ..., '2020-12-29T00:00:00.000000000', '2020-12-30T00:00:00.000000000', '2020-12-31T00:00:00.000000000'], dtype='datetime64[ns]') - lat(lat)float32-89.88 -89.62 ... 89.62 89.88
- long_name :
- Latitude
- standard_name :
- latitude
- units :
- degrees_north
- actual_range :
- [-89.875 89.875]
- axis :
- Y
array([-89.875, -89.625, -89.375, ..., 89.375, 89.625, 89.875], dtype=float32) - lon(lon)float320.125 0.375 0.625 ... 359.6 359.9
- long_name :
- Longitude
- standard_name :
- longitude
- units :
- degrees_east
- actual_range :
- [1.25000e-01 3.59875e+02]
- axis :
- X
array([1.25000e-01, 3.75000e-01, 6.25000e-01, ..., 3.59375e+02, 3.59625e+02,
       3.59875e+02], dtype=float32)
- long_name :
- Daily Sea Surface Temperature
- units :
- degC
- valid_range :
- [-3. 45.]
- precision :
- 2.0
- dataset :
- NOAA High-resolution Blended Analysis
- var_desc :
- Sea Surface Temperature
- level_desc :
- Surface
- statistic :
- Mean
- parent_stat :
- Individual Observations
- actual_range :
- [-1.8 35.059998]
It is also possible to use the attributes of a data variable.
print(sst.long_name+' from the '+sst.dataset +' is in '+sst.units)
Daily Sea Surface Temperature from the NOAA High-resolution Blended Analysis is in degC
sst.sel(lat=(28),method='nearest').mean(dim=('time'))
<xarray.DataArray 'sst' (lon: 1440)>
array([nan, nan, nan, ..., nan, nan, nan], dtype=float32)
Coordinates:
    lat      float32 28.12
* lon (lon) float32 0.125 0.375 0.625 0.875 ... 359.1 359.4 359.6 359.9- lon: 1440
- nan nan nan nan nan nan nan nan ... nan nan nan nan nan nan nan nan
array([nan, nan, nan, ..., nan, nan, nan], dtype=float32)
- lat()float3228.12
- long_name :
- Latitude
- standard_name :
- latitude
- units :
- degrees_north
- actual_range :
- [-89.875 89.875]
- axis :
- Y
array(28.125, dtype=float32)
- lon(lon)float320.125 0.375 0.625 ... 359.6 359.9
- long_name :
- Longitude
- standard_name :
- longitude
- units :
- degrees_east
- actual_range :
- [1.25000e-01 3.59875e+02]
- axis :
- X
array([1.25000e-01, 3.75000e-01, 6.25000e-01, ..., 3.59375e+02, 3.59625e+02,
       3.59875e+02], dtype=float32)
Using the data#
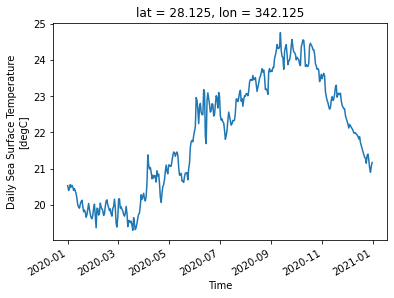
Let’s use the data. First, to see the time series of SST near the beautiful Canary Islands, and after that, the mean global SST.
#In the metadata there is no reference for the grid resolution
sst.lon[0]-sst.lon[1]
<xarray.DataArray 'lon' ()>
array(-0.25, dtype=float32)
- -0.25
array(-0.25, dtype=float32)
sst.sel(lon=(360-18), lat=28, method='nearest').plot()
[<matplotlib.lines.Line2D at 0x166227cd0>]
#28N 18W
sst[:,(90+28),(360-18)].plot()
[<matplotlib.lines.Line2D at 0x166c71c40>]
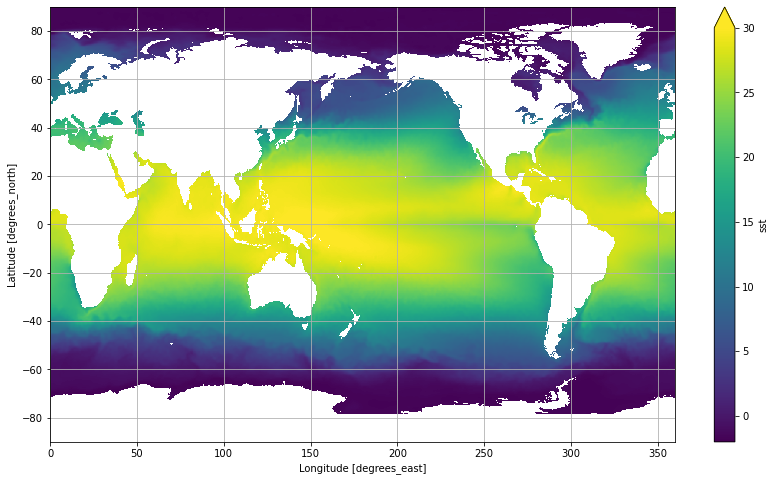
fig, ax = plt.subplots(figsize=(14,8))
sst.mean(dim='time').plot(vmin=-2, vmax=30)
ax.grid()
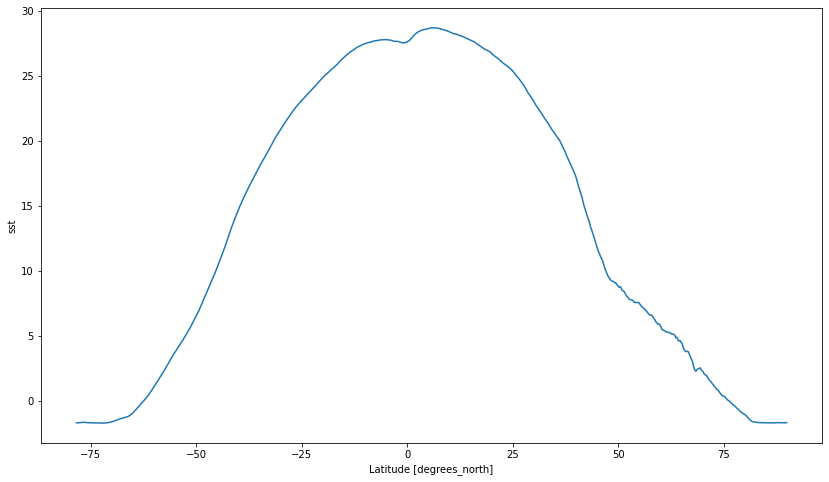
fig, ax = plt.subplots(figsize=(14,8))
sst.mean(dim=('time', 'lon')).plot()
[<matplotlib.lines.Line2D at 0x16c12f130>]
Remote data access via openDAP#
With OPeNDAP, you can access data using an URL rather than a local path. For xarray it is like having the file locally, the only difference is that you provide a different path.
OPeNDAP stand for Open-source Project for a Network Data Access Protocol More information here
https://www.psl.noaa.gov/data/gridded_help/using_dods.html
dap_url="http://psl.noaa.gov/thredds/dodsC/Datasets/noaa.oisst.v2.highres/sst.day.mean.2020.nc"
dataOP = xr.open_dataset(dap_url)
dataOP
<xarray.Dataset>
Dimensions:  (time: 366, lat: 720, lon: 1440)
Coordinates:
  * time     (time) datetime64[ns] 2020-01-01 2020-01-02 ... 2020-12-31
  * lat      (lat) float32 -89.88 -89.62 -89.38 -89.12 ... 89.38 89.62 89.88
  * lon      (lon) float32 0.125 0.375 0.625 0.875 ... 359.1 359.4 359.6 359.9
Data variables:
    sst      (time, lat, lon) float32 ...
Attributes:
    Conventions:                     CF-1.5
    title:                           NOAA/NCEI 1/4 Degree Daily Optimum Inter...
    institution:                     NOAA/National Centers for Environmental ...
    source:                          NOAA/NCEI https://www.ncei.noaa.gov/data...
    References:                      https://www.psl.noaa.gov/data/gridded/da...
    dataset_title:                   NOAA Daily Optimum Interpolation Sea Sur...
    version:                         Version 2.1
    comment:                         Reynolds, et al.(2007) Daily High-Resolu...
DODS_EXTRA.Unlimited_Dimension: time- time: 366
- lat: 720
- lon: 1440
- time(time)datetime64[ns]2020-01-01 ... 2020-12-31
- long_name :
- Time
- delta_t :
- 0000-00-01 00:00:00
- avg_period :
- 0000-00-01 00:00:00
- axis :
- T
- actual_range :
- [80353. 80718.]
- _ChunkSizes :
- 1
array(['2020-01-01T00:00:00.000000000', '2020-01-02T00:00:00.000000000', '2020-01-03T00:00:00.000000000', ..., '2020-12-29T00:00:00.000000000', '2020-12-30T00:00:00.000000000', '2020-12-31T00:00:00.000000000'], dtype='datetime64[ns]') - lat(lat)float32-89.88 -89.62 ... 89.62 89.88
- units :
- degrees_north
- actual_range :
- [-89.875 89.875]
- axis :
- Y
- standard_name :
- latitude
- long_name :
- Latitude
array([-89.875, -89.625, -89.375, ..., 89.375, 89.625, 89.875], dtype=float32) - lon(lon)float320.125 0.375 0.625 ... 359.6 359.9
- axis :
- X
- long_name :
- Longitude
- standard_name :
- longitude
- units :
- degrees_east
- actual_range :
- [1.25000e-01 3.59875e+02]
array([1.25000e-01, 3.75000e-01, 6.25000e-01, ..., 3.59375e+02, 3.59625e+02,
       3.59875e+02], dtype=float32)
- sst(time, lat, lon)float32...
- long_name :
- Daily Sea Surface Temperature
- units :
- degC
- valid_range :
- [-3. 45.]
- precision :
- 2.0
- dataset :
- NOAA High-resolution Blended Analysis
- var_desc :
- Sea Surface Temperature
- level_desc :
- Surface
- statistic :
- Mean
- parent_stat :
- Individual Observations
- actual_range :
- [-1.8 35.059998]
- _ChunkSizes :
- [ 1 720 1440]
[379468800 values with dtype=float32]
- Conventions :
- CF-1.5
- title :
- NOAA/NCEI 1/4 Degree Daily Optimum Interpolation Sea Surface Temperature (OISST) Analysis, Version 2.1
- institution :
- NOAA/National Centers for Environmental Information
- source :
- NOAA/NCEI https://www.ncei.noaa.gov/data/sea-surface-temperature-optimum-interpolation/v2.1/access/avhrr/
- References :
- https://www.psl.noaa.gov/data/gridded/data.noaa.oisst.v2.highres.html
- dataset_title :
- NOAA Daily Optimum Interpolation Sea Surface Temperature
- version :
- Version 2.1
- comment :
- Reynolds, et al.(2007) Daily High-Resolution-Blended Analyses for Sea Surface Temperature (available at https://doi.org/10.1175/2007JCLI1824.1). Banzon, et al.(2016) A long-term record of blended satellite and in situ sea-surface temperature for climate monitoring, modeling and environmental studies (available at https://doi.org/10.5194/essd-8-165-2016). Huang et al. (2020) Improvements of the Daily Optimum Interpolation Sea Surface Temperature (DOISST) Version v02r01, submitted.Climatology is based on 1971-2000 OI.v2 SST. Satellite data: Pathfinder AVHRR SST and Navy AVHRR SST. Ice data: NCEP Ice and GSFC Ice. Data less than 15 days old may be subject to revision.
- DODS_EXTRA.Unlimited_Dimension :
- time
The only difference in accesing the data via OPeNDAP is that you can not plot it explicitily, i.e., something like:
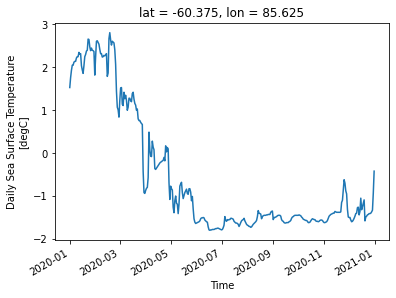
dataOP.sel(lon=(360-18), lat=28, method='nearest').plot()
but you have to create the datasets to later plot them:
dataOPsubsampled=dataOP.sel(lon=(360-18), lat=28, method='nearest')
fig, ax = plt.subplots(figsize=(14,8))
ax.plot(dataOPsubsampled.sst)
ax.set_title(dataOP.title)
ax.grid()
Closing your netCDF file#
It’s good to close netCDF files, but not necessary when Dataset is open for reading access only.
xrDS.close()
---------------------------------------------------------------------------
NameError                                 Traceback (most recent call last)
<ipython-input-1-8bccc64547d3> in <module>
----> 1 xrDS.close()

NameError: name 'xrDS' is not defined